Make sense of clinical trials
Simple answers to what trials are, how they work, and what to ask.
Let’s learn together →Optional: choose a calmer colour, a quieter layout and the tone Patient Genie uses for general trial explanations. This is not a health assessment, is never guessed from what you type, and is not saved or sent anywhere. Choose “No preference” to reset.
No preference selected. Colours and Patient Genie wording stay neutral.
Create an account or sign in. Browsing, learning and trial search work without one.
Find real clinical trials, understand how research works, and prepare your questions at your own pace.
Illustrative portraits—not patients, participants or testimonials. Credits and licences are under Photo sources & usage.
Photos require an internet connection.



Simple answers to what trials are, how they work, and what to ask.
Let’s learn together →Explore global health data and understand why research matters.
Explore world health →Build a question checklist to take to your care team or a study site.
Plan my next step →Your choice. Our commitment. Hope through research.
From regulators and pharmaceutical researchers to clinical research professionals, your doctors and nurses—a shared commitment to protecting your rights, listening to your questions, and advancing care through responsible research.
We aim to welcome people of every background, culture and language. Research should invite questions, respect individual needs, and never pressure anyone to participate.
Hope is not a promise of benefit. Clinical trials involve risks, and a study treatment may not help you. Discuss your options with your care team.
Choose an illustrated area, then your country. See what registry-listed studies investigate and which local sites report recruiting.
Study terminology and patient guidance: ClinicalTrials.gov glossary ↗ · Patient information ↗
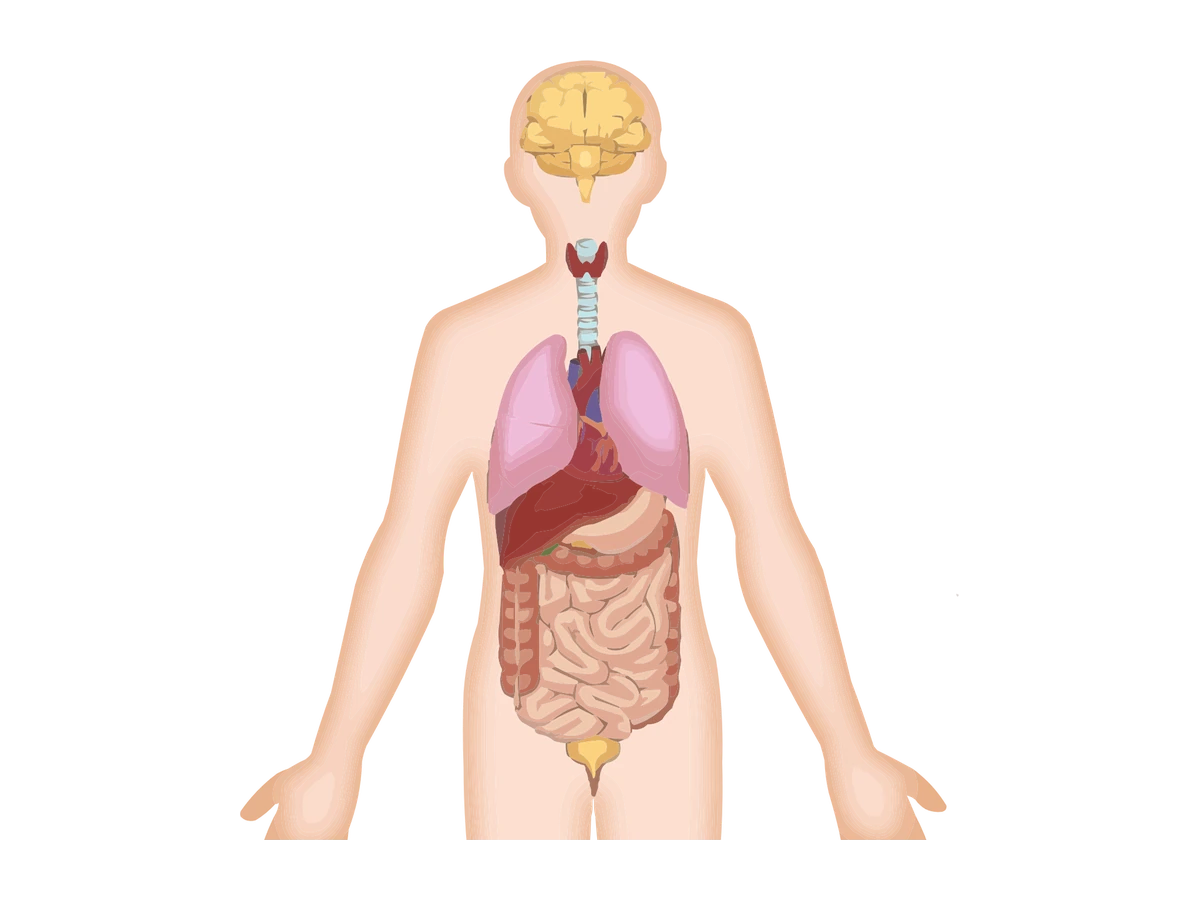
Watch the anatomy video, select an organ, and explore its structure, function and source-linked health information.
Ask about trial basics, your rights, or how to find a study. A friendly place to begin.
Understand investigator-led research, responsibilities and questions to take to your institution.
Search public trial registries for studies on any condition, then check which sites in your city or country report that they are recruiting.
The official link carries disease and location. Reapply status filters on the registry; exact local-site matching is performed in this shell.
A page contains up to 100 registry candidates. Counts exclude unloaded pages. City and site filters are checked against the same site record.
Explore what interventions are being studied across 16 areas. Choose a country to find matching trial sites, research approaches and study-team contacts from ClinicalTrials.gov.
A recently posted study is not necessarily a proven advance. An investigational treatment may or may not benefit you. Availability, eligibility and approval require confirmation.
All 16 areas have picture panels: organ and body images from the supplied anatomy video, or illustrative stock photographs for other topics. Select an area to enlarge its picture. Stock photos need internet; if one cannot load, its panel clearly labels the offline concept illustration instead.
16 areas shown
The registry describes an intervention and the question being tested. It does not establish that the intervention works.
Results can be positive, negative, inconclusive or limited. Read the official results and discuss their relevance with a qualified professional.
Approval, standard of care and suitability in your country require a local regulator or healthcare professional—not an inference from trial phase or listing.
Reference: ClinicalTrials.gov patient information ↗. Information is educational and does not replace medical advice.
Choose an area and country, then select Search research. No query has been sent.
Real registry records will appear after you submit a search. No sample studies or unsupported “latest breakthroughs” are displayed.
The official search link carries area/condition and location; reapply other filters on the registry. Up to 100 candidates load per page. Counts cover loaded records only, not all research in a country or all national registries.
ClinicalTrials.gov includes studies from many countries, but it is not an exhaustive national research inventory. Search WHO’s trial-search portal for additional participating registries and verify any country-specific requirements with the study team.
WHO international trial search ↗External registry results are not merged automatically. No cross-registry completeness or duplicate-removal claim is made.
No medical background needed. Explore short explainers and build the confidence to ask your own questions.
Explore each learning step, then discuss what applies to you with a healthcare professional or study team.
This shows a typical path, not a promise of care or a fixed order for every study. You can pause, choose a step, or continue at your own pace.
Researchers begin with a health question. Research does not replace your own medical care.
The protocol (the written study plan) is reviewed, and the study team explains risks, other options and your choices. Screening and consent timing can vary. Taking part is voluntary and benefit is not guaranteed. Source: ClinicalTrials.gov ↗
For your own reflection—not a test or a requirement to participate. Progress is kept only in this browser on this device.
Understand the essentials in three simple diagrams.
A research study with people that tests a health-related question under a written plan (protocol).
Personal benefit is not guaranteed. Weigh possible benefits and risks with your care team.
Simplified education. Steps and phases vary by study; not every study has all phases. Participation is voluntary and eligibility is decided by the study team.
A simplified guide for drug trials. Other study types may not have a phase.
Early Phase 1 studies also exist. Phases can be combined, and a later phase does not guarantee benefit or safety.
No. Your assigned group may receive the study treatment, standard care, a placebo, or another comparison. Ask about the study design and how groups are assigned.
Ask what the sponsor covers, what may be billed to you or your insurer, and whether travel or other expenses are reimbursed. Do not assume that participation is free or paid.
A caregiver or trusted person can help you prepare questions and understand information. Ask the study team about support, accessibility, translation, and the applicable consent process.
Travel through the body in 3D, choose an organ, then zoom in to its tissue and cells to see how it works.
Choose an organ to see where it sits in the body.
Choose an organ
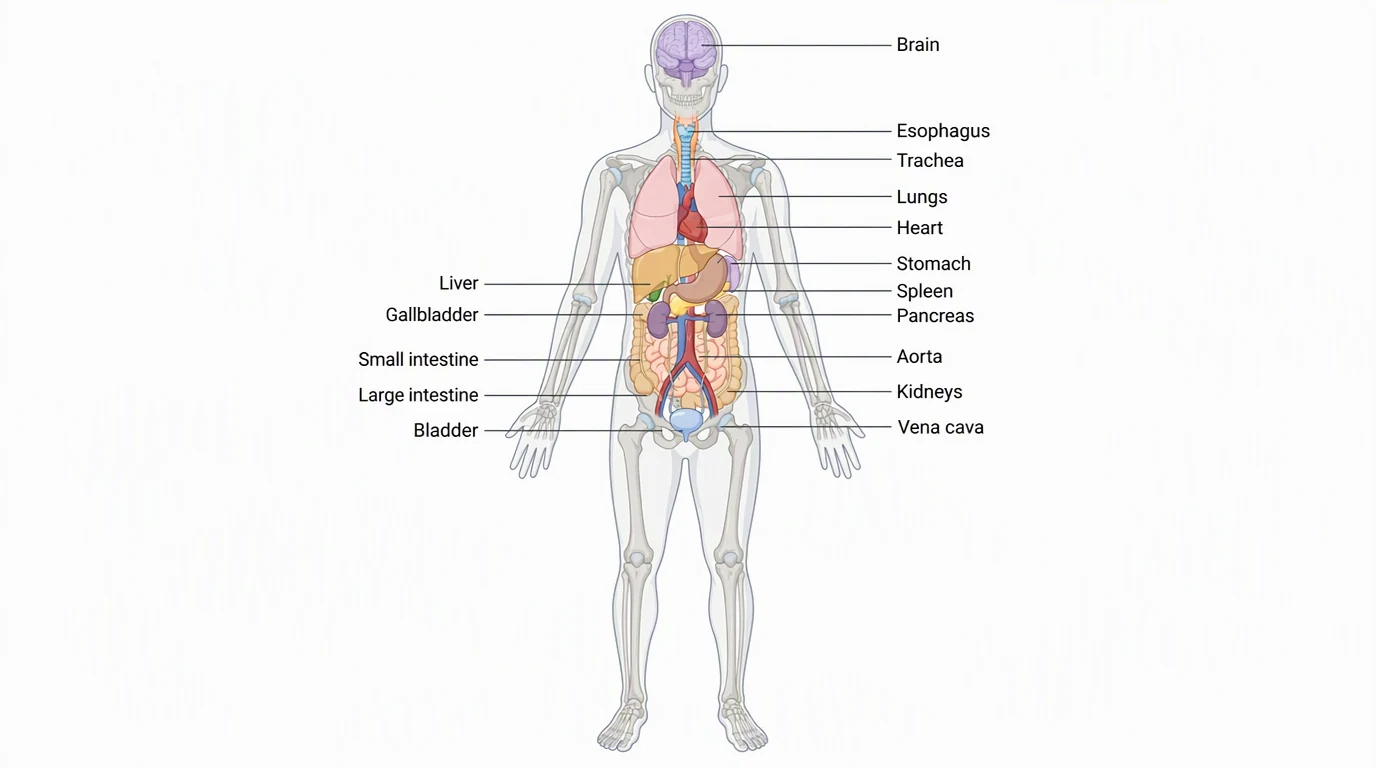
A see-through human figure turns, then the view moves in through the chest wall to the lungs and heart, down past the liver and stomach to the intestines, kidneys and bladder, round to the spine and up to the brain. It is a stylized animation, not a patient scan.
Tip: double-click the picture to go one level closer. Use Ctrl and the mouse wheel, or pinch, to zoom; drag to move a zoomed picture.
Explore worldwide WHO estimates and an Asia-Pacific source view. Keep global and regional measurements distinct as you move around the map.
Selected WHO estimates • each card states its period and measure
| Rank | Cause | Broad group |
|---|
Only source-supported observations and change statements
Find an available WHO profile, open a WHO source search, or carry the disease into a city-level trial search.
All disease terms are accepted for registry/source search. The embedded burden collection still covers only the stated WHO topics; this search does not invent missing statistics.
Topographic map tiles require internet access.
Drag to pan, scroll or pinch to zoom. At higher zoom levels the online basemap shows local place names and terrain. Region labels are geographic callouts, not territory boundaries. Map colours show geography—not disease severity. Location search does not create a country-level estimate.
| Topic / measure | Geography | Reference period | Published estimate | Population | Source / notes |
|---|
Source notes include uncertainty, publication metadata and definitions. Unknown uncertainty is not a zero-width interval. Subsets and overlapping conditions must not be added together.
World Health Statistics 2026 was published 13 May 2026. Its listing links to tables by country and area, WHO region and globally.
WHO statistics tables and reports ↗GHE downloads cover 2000, 2010, 2015, 2019, 2020 and 2021, including death, DALY, YLL and YLD estimates.
WHO country and regional burden downloads ↗For study teams listed in a public trial registry: see the people who asked to be put in touch with you, record where they are in your process, and tell Bloom whether your study is taking new participants.
This site has not switched on Bloom for Sites. It needs a published privacy notice that covers study-team accounts and referrals.
A private profile that you control, to help you get ready to talk to a study team. Creating an account, storing health information, storing genetic information and sharing are four separate choices. Nothing here is shared with anyone, and nothing here is a diagnosis or a decision about whether you can join a study.
Withdrawing deletes what the choice covered from the live database. Downloads you made and operator backups need separate handling. Account export (My Profile, Review & export) includes your Health Passport.
Upload a text-based PDF (up to 25 pages), DOCX or plain-text file of up to 1 MB. Bloom looks only for lines written as “Field name: value” that match Health Passport field names, and shows them as suggestions. Nothing is saved until you choose the values to accept. Scanned images, password-protected files and photos are not read.
Check each value against your document. Only ticked values are copied, and only into fields you left empty. Suggestions are not verified and are never a diagnosis.
Not built yet: eligibility readiness, trial matching and consented sharing with a study team. They need each study’s own rules and a reviewer, so they are not part of this release.
A simple, searchable framework based on the WHO ICD-11 chapter structure, used to describe a condition in your Health Passport. It helps you name your condition at the right level. It does not diagnose, and it does not decide eligibility.
Explore source-linked population context. A registration request is checked by an administrator and does not give access to participant contacts, Health Passport data or recruitment leads.
Create an organisation request. An administrator checks it before any organisation feature opens.
Explore the WHO region observations in this release. No social-media feeder is connected.
View heatmap →Explore WHO-sourced global and Asia-Pacific views with their original reference periods and denominators.
Open the WHO atlas →Browse the condition labels that study teams submitted to the public registry. They include diseases and other health topics. This is not a curated disease list, and it is not complete until every registry page for the search has been loaded.
Nothing is sent to the registry until you press Browse registry, and then only the optional search words you typed. No account, participant or Health Passport information is used. A condition appearing here does not mean a study is recruiting near you or that anyone is eligible. Information is educational and does not replace medical advice.
WHO source-linked regional observations. They are not predictions and not a map of individual participants.
Only authorised, purpose-limited, non-identifying aggregate signals with a documented source, date, area, denominator, right to use and privacy assessment could ever appear here. Group membership or post volume cannot show how common a disease is, who is diagnosed, who is eligible or who is willing to take part. Small counts would have to be hidden. Nothing is scraped or collected in this release.
Review organisation requests and read the audit trail. A decision takes effect at once. This console cannot show anyone’s Health Passport, health information, messages or profile.
The latest 200 events: what happened, when, and the kind of account. No names, emails or content.
| When | Event | Account type |
|---|
Plan outreach across disease-topic communities using authorised aggregate reports: not messages, member lists or guessed diagnoses. Admins import the reports; approved organisations can read them.
Broad, non-identifying topics and regions only. There is no way to search for a person.
Visibility is reported by whoever supplied the data and is not checked by Bloom. “Private” never gives access to a group or its members.
| Community / topic | Region | Visibility | Reported members | Voluntary interest* | Observed / source |
|---|
*What the source reports about people who chose to say they are interested through a separate approved process. These are not eligible people, enrolments or permission to message anyone. Blank values stay “Unknown”. Values below 10 are shown only as “Hidden (under 10)”. Hiding small counts lowers the risk of identifying anyone but does not guarantee anonymity.
Accepted input is one authorised snapshot of community-level counts. Get such reports through an approved process outside Bloom. Admin access alone is not permission to disclose anyone’s health information.
Recipient: this Bloom service and its operator. Purpose: community-level outreach planning. Fields: the 8 template fields only. No member identities or messages are accepted.
| Community | Topic | Region | Visibility | Members | Voluntary interest | Permission | Observed |
|---|
Bloom does not receive form answers, contacts, consent records or health information. An account or group membership is never consent to be contacted.
We are sharing an optional resource for people who would like to learn about clinical research. Please do not post medical information or contact details in this group. If you choose to explore further, read the operator’s privacy notice and use its approved sign-up page. Opening the page does not enrol you or confirm eligibility. You do not need to reply or take part.
This is not a disease explanation or an advert for a study. Wording about a particular study needs its own approval. Bloom posts and sends nothing.
Not set up. No information is collected and no outreach link is active.
Before you leave Bloom: Bloom sends no profile, topic, group code, counts or answers. Opening the outside page shares ordinary connection details, such as your IP address, with whoever runs it. That page handles its own collection and consent.
Open the voluntary sign-up page ↗Keep proposed community group links together while you arrange taking part with their organisers. Being an Admin here gives no authority over any outside group.
Links are shown as text and never opened or fetched. Copying one does not connect the group. Removing one affects only this list: snapshots, downloads and backups stay as they are.
| Label / link | Status | Saved | Actions |
|---|
No saved links to show.
To pursue statistics, contact the group administrator separately and ask whether they would like to provide an authorised aggregate report. Bloom creates no approval link and does not check anyone’s identity.
The latest 100 events that are still kept. It is an operations log, not a tamper-proof regulatory audit trail.
| Time | What happened | Rows |
|---|
Removes the saved snapshot. Downloads, backups and the activity log entries stay. Nobody’s individual records are held here, so there is nothing to withdraw: questions about an outside form go to whoever runs it.
From a clinical question to a research discussion. Explore who does what, what to prepare and which questions to take to your institution.
Often abbreviated IIT, and sometimes called an investigator-sponsored study.
A plan that puts participants first.
This guide is available in all six site languages. Linked outside sources may be in English only.
An investigator-initiated trial begins with a research question proposed by an investigator or academic team. The investigator may work with an institution, funder or other collaborators. The actual sponsor and responsibilities must be confirmed for the particular study.
A sponsor-investigator is an individual who both initiates and conducts the investigation. Not every investigator-led project uses that legal arrangement. The principal investigator (PI) leads the conduct of the study.
Source: NIH explanatory role definitions ↗ (background explanation, not current legal advice). See current registry policy ↗ and consult your institution.
Source: NIH responsible-party explanatory note ↗. Information is educational and does not replace medical advice.
| Role / group | Plain-language purpose | Question to ask |
|---|---|---|
| Investigator / PI | Leads the conduct of the research and the participant-facing study team. | Who is accountable for the protocol, participant evaluation and research records? |
| Sponsor / sponsor-investigator | The identified initiator or accountable sponsoring arrangement; may differ from the funder. | Who accepts the applicable sponsor responsibilities? |
| Ethics committee / IRB | Independent review of the research and participant protections through the applicable local process. | Which review and consent requirements apply here? |
| Institutional research office | Helps clarify institutional permissions, contracts and applicable obligations. | Which specialists must confirm the regulatory and operational route? |
| Study coordinator and support team | Support visits, records and communications under the study plan. | Who handles day-to-day questions, safety escalation and secure communication? |
| Participant / caregiver | Can ask questions and make an informed, voluntary choice about participation. | What are the risks, possible benefits, alternatives and visit commitments? |
Sources: ClinicalTrials.gov definitions ↗ · Patient information ↗. Information is educational and does not replace medical advice.
Keep notes in this page for the current session, or download a text file for your own use.
Planning prompts are a Bloom discussion aid, informed by registry protocol definitions ↗. No jurisdiction-specific compliance or approval decision is made. Information is educational and does not replace medical advice.
Carry your disease and city into trial search. This does not restrict results to verified IITs.
No query is sent until you press Search trials on the next page. Ask the listed study team who initiated the trial and which institution or person is the sponsor.
Registration and reporting policy ↗ · Registry field definitions ↗
Short, source-linked primers on the research areas behind clinical trials. Choose a reading level: for patients and families, or for research staff.
Each primer is a draft until a clinical reviewer signs it off. It is educational, not accredited training, and there are no certificates.
Your reading and quiz progress stays on this device.
Gather questions, keep interesting studies together, and decide what feels right for you.
Tick the questions you’d like to ask. Download a copy to bring to an appointment.
No personal details are collected. Your selections are kept only in this browser on this device.
Learning about a trial does not commit you to joining. A care-team conversation can help you weigh the possible benefits, risks, and practical details.
Check the purpose, location, visits, and requirements.
Ask about availability and screening. Do not stop or change treatment on your own.
Take time to ask questions and discuss your options.
Help a friend or caregiver get comfortable with the basics—without sharing your health information.
Saved only in this browser on this device. Saved copies can go out of date, so open the official record for the current status. Demo cards remain fictional.
Studies you are interested in, the site you chose and how far you have got. Kept only in this browser on this device: nothing is sent to Bloom, your account or the study team. Items with no update for a year are removed automatically.
Create an account or sign in to keep a small profile: your nickname, your role and your preferences.
Account email and profile fields are encrypted in storage. Professional roles are self-declared and grant no clinical permissions.
How Bloom protects your privacy →Open this shell through the included server, not by double-clicking the HTML. Install the package, run the server and open its local URL. No account data is saved in browser local storage.
Checking account service…
We sent a message to
Open the confirmation link in it within 48 hours to finish creating your account. If you already have an account with this address, the message explains how to sign in instead.
Nothing there after a few minutes? Check your spam folder, or sign in with your new password to get a fresh link.
Review the privacy notice first. Registration details remain disabled until you select Next and the server records the stated acknowledgements.
The operator must publish its privacy information and supported jurisdictions before new account details can be collected.
Review the identified operator’s Privacy Policy and Terms of Use before entering account/profile information. This account service does not automatically share profiles with study teams or send research recruitment messages. It stores a phone number, a postal address or health records only where a separately switched-on feature (organisation registration, the Health Passport) says so, and only what you enter. Privacy acknowledgement is not informed consent to join a clinical trial.
Signing up does not collect health information. The optional Health Passport, where the site has switched it on, asks for its own separate choice first. Local eligibility questions have a separate notice before entry.
Not authorised by NextNo automatic profile transfer. A future sharing flow must identify the study, recipients, exact fields and purpose before you choose.
Not enabledNo outbound calling service is enabled. A phone number, where the site asks for one, is used only to manage the account. Affiliates have no blanket permission to call.
Not enabledNo SMS service is enabled. A future SMS flow requires a separate choice, sender and opt-out information before collecting a number.
Not enabledYour jurisdiction choice and the acknowledgements below are sent to this operator’s service to record this step. No name, email, phone number or health information is requested here. This does not authorize trial participation.
If your location is not listed, do not choose another one. Continue without an account or contact the privacy contact shown above.
You can browse public educational information without creating an account. Optional outreach must not be a condition of access to general learning. Requirements depend on the operator, your location, applicable law and the actual service being offered.
Email confirmed · role self-declared · no special access granted
Save these recovery codes now. Each works once if you lose your phone. They are shown only this time.
Only a browser and system name are kept for each sign-in: no IP address or location.
Bloom emails you at most once a week when new recruiting studies on ClinicalTrials.gov match a saved search. Add one with “Email me new matches” next to a saved search on the trial page.
The database stores this account and profile, and only what you choose to send through Bloom Connect (interest sent to study teams and email alerts). Chat, eligibility answers and IIT notes remain session-only. Saved studies, saved searches, trial interests, checklist choices, lesson progress and training progress stay only in this browser on this device and are not synchronized to this account. Sign out before sharing a device; signing out reloads the page to clear session work.
It is not read or automatically uploaded. You can remove that one legacy browser-storage record here; this does not change a server account.
A notice for this deployment and the account service. This page is not a promise that every legal requirement in every country has been met.
Bloom is built on the privacy-by-design principles of the EU and UK GDPR and uses safeguards modelled on the US HIPAA Security Rule.
Reading, study searches, primers and Patient Genie work without an account. An account holds your email, a hashed password and a small profile. Bloom asks for a postal address, a phone number or health information only in features the site has switched on, and only after you choose to use them.
Connections use HTTPS. Your account email and profile are encrypted in the database, and passwords are kept only as a one-way hash.
Secure session cookies, automatic sign-out when you are inactive, limits on repeated sign-in attempts, and a list of signed-in devices that you can sign out.
Eligibility answers, saved studies and searches, checklists and primer progress stay in this browser. They are never sent to Bloom or to your account. Patient Genie answers the safety questions it recognises on this device and sends other general questions through Bloom’s server to an AI service for an answer; Bloom does not save the chat.
In My account you can see and correct your details, download a copy of them, or delete your account at any time.
Bloom adds no advertising, analytics or tracking cookies. Its server logs contain no email addresses, IP addresses or passwords.
Data minimisation, purpose limitation and security by default, plus the rights of access, correction, portability and erasure in My account. The operator’s Privacy Policy names the data controller, the lawful basis for each use and how to complain to a data protection authority.
On its own, the account service does not collect protected health information such as medical records. If the operator switches on the optional Health Passport, it stores the health information you choose to enter, encrypted, and the operator’s Privacy Policy states whether HIPAA applies to it. Its safeguards follow the approach of the HIPAA Security Rule: access control, encryption, audit records and automatic sign-out. HIPAA applies to health-care providers, health plans and their business associates; the operator’s Privacy Policy states whether it applies to this site.
These safeguards are built into the software. They are not a certification: the organisation that runs this site is responsible for its Privacy Policy and for meeting the laws that apply to it, including other national privacy laws.
The responsible organisation, contact, legal jurisdictions, policies, retention and transfer arrangements must be configured before new account details can be collected. This file cannot certify legal compliance by itself.
Account creation does not authorise the collection of medical records, sharing with a study team, automated calls or SMS. Health records have their own separate Health Passport choice where the site offers it; sharing, calls and SMS are not enabled. The Next step records only the specific account acknowledgements displayed before the form.
Contact the deployment operator for the applicable Privacy Policy and Terms of Use. Do not enter personal or sensitive information into an unconfigured deployment.
Signed-in users can review/edit their profile, export account/profile information and privacy acknowledgements, or delete their account after password confirmation. Consent to receive calls or texts is not stored because those services are not enabled.
A new notice is shown before registration or profile editing. If you decline, no new profile is submitted; declining does not erase an existing account. Use Delete account to remove it, or contact the configured privacy contact to exercise applicable rights, make a complaint or discuss a request.
Account deletion removes the live account/profile, associated sessions, consents and linked privacy acknowledgements. Unlinked security-event entries and operator-controlled backups may remain according to the stated retention arrangements. Previously downloaded files and external recipients’ records are not remotely deleted.
Where processing relies on consent, withdrawal does not by itself undo processing that was lawful before withdrawal. Any legally required retention or alternative legal basis must be explained by the responsible operator under the applicable policy and law.
Sensitive-health processing, sharing with named study personnel, automated/prerecorded calling and SMS require their own reviewed purpose-specific controls where applicable. Unchecked opt-ins must describe who contacts you, why, what is shared and how to stop contact. Phone/SMS choices must not be bundled into the account “Next” button.
A text programme must disclose applicable message/data rates and message expectations and implement the stated opt-out/help process before soliciting permission. This release does not send texts or calls, use phone numbers for texts or calls, or claim to process STOP requests.
The address may be mistyped or out of date. These pages are a good place to start.